PF3D7_0111000 kinesin-8, putative
Disruptability [+]
| Species | Disruptability | Reference | Submitter | |
|---|---|---|---|---|
| P. falciparum 3D7 |
Possible |
USF piggyBac screen (Insert. mut.) | USF PiggyBac Screen | |
| P. berghei ANKA |
Possible |
PlasmoGEM (Barseq) | PlasmoGEM | |
| P. berghei ANKA |
Possible |
RMgm-4673 | Imported from RMgmDB | |
| P. berghei ANKA |
Possible |
RMgm-4682 | Imported from RMgmDB | |
| P. berghei ANKA |
Possible |
RMgm-4957 | Imported from RMgmDB | |
| P. berghei ANKA |
Possible |
RMgm-5009 | Imported from RMgmDB | |
Mutant phenotypes [+]
| Species | Stage | Phenotype | Reference | Submitter |
|---|---|---|---|---|
| P. berghei ANKA | Asexual |
No difference |
PlasmoGEM (Barseq) | PlasmoGEM |
| P. berghei ANKA | Asexual |
No difference |
RMgm-4673 | Imported from RMgmDB |
| P. berghei ANKA | Asexual |
No difference |
RMgm-4682 | Imported from RMgmDB |
| P. berghei ANKA | Asexual |
No difference |
RMgm-4957 | Imported from RMgmDB |
| P. berghei ANKA | Asexual |
No difference |
RMgm-5009 | Imported from RMgmDB |
| P. berghei ANKA | Gametocyte |
Difference from wild-type |
RMgm-4673
Normal numbers of male/female gametocytes are formed. No male gamete formation (exflagellation). |
Imported from RMgmDB |
| P. berghei ANKA | Gametocyte |
Difference from wild-type |
RMgm-4682
Normal production of male and female gametocytes. No male gamete formation as shown by absence of exflagellation centers. |
Imported from RMgmDB |
| P. berghei ANKA | Gametocyte |
Difference from wild-type |
RMgm-4957
Strongly reduced male gamete formation/exflagellation. |
Imported from RMgmDB |
| P. berghei ANKA | Gametocyte |
Difference from wild-type |
RMgm-5009
No male gametes are produced (no exflagellation) |
Imported from RMgmDB |
| P. berghei ANKA | Ookinete |
Difference from wild-type |
RMgm-4673
Normal numbers of male/female gametocytes are formed. No male gamete formation (exflagellation). No ookinete formation. |
Imported from RMgmDB |
| P. berghei ANKA | Ookinete |
Difference from wild-type |
RMgm-4682
Strongly reduced fertilisation and ookinete formation. In wild type parasites, the mean ookinete conversion rate as 63.5 3.6, whereas it was only 1.2 1.4 and 0.2 0.2 for Pbkin8B clones 3600 and 3716. |
Imported from RMgmDB |
| P. berghei ANKA | Ookinete |
Difference from wild-type |
RMgm-5009
No male gametes are produced. No fertilisation/ookinete formation |
Imported from RMgmDB |
| P. berghei ANKA | Oocyst |
Difference from wild-type |
RMgm-4673
No ookinete formation. No oocyst formation. |
Imported from RMgmDB |
| P. berghei ANKA | Oocyst |
Difference from wild-type |
RMgm-4682
Strongly reduced fertilisation and ookinete formation. In wild type parasites, the mean ookinete conversion rate as 63.5 3.6, whereas it was only 1.2 1.4 and 0.2 0.2 for Pbkin8B clones 3600 and 3716. The two Pbkin8B mutant cell lines produced very few oocysts (mean range of 1.68/1.36 and 1.4/0.76 respectively) in comparison to wt and Pbkin8B-gfp parasites, where numerous oocysts were formed (mean values the 2 replicates of 180/171 and 187/160 oocysts per midgut respectively. No sporozoite formation observed in oocysts. |
Imported from RMgmDB |
| P. berghei ANKA | Oocyst |
Difference from wild-type |
RMgm-5009
No ookinetes; no oocysts |
Imported from RMgmDB |
| P. berghei ANKA | Sporozoite |
Difference from wild-type |
RMgm-4682
The two Pbkin8B mutant cell lines produced very few oocysts (mean range of 1.68/1.36 and 1.4/0.76 respectively) in comparison to wt and Pbkin8B-gfp parasites, where numerous oocysts were formed (mean values the 2 replicates of 180/171 and 187/160 oocysts per midgut respectively. No sporozoite formation observed in oocysts. |
Imported from RMgmDB |
| P. berghei ANKA | Liver |
Difference from wild-type |
RMgm-4682
No infection of mice by bite of infected mosquitoes |
Imported from RMgmDB |
Imaging data (from Malaria Metabolic Pathways)
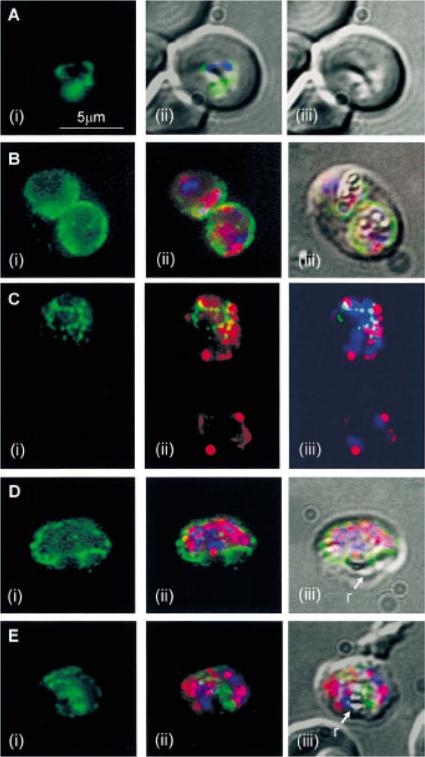
Fluorescent images of P. falciparum trophozoites (A&B), and schizonts (C–E), labelled with antibodies to kinesin heavy chain (green) and a-tubulin (red), and DAPI nuclear stain (blue). A(i) kinesin labelling appears as two crescents, each associated with one of the two nuclei, distinguished by the DAPI staining overlaid on the image in plate (ii). The rest of the labelling corresponds to the shape of the parasite cell body, apparent as an indentation in the DIC image in plates (ii) and (iii). B(i) shows two trophozoites inside one red blood cell, showing kinesin labelling, around the periphery of one, and concentrated on one side of the other. C(i) shows kinesin labelling as short linear arrays of fluorescent dots in one parasite, and no labelling in a second parasite at the bottom of the plate. D(i) kinesin labelling appears around the periphery of a schizont. E(i) kinesin labelling appears in the cell body of a schizont. In all plates kinesin labelling was not co-incident with a-tubulin or DAPI staining, nor the residual body (r), seen in the overlaid DIC image. Fowler RE, Smith AM, Whitehorn J, Williams IT, Bannister LH, Mitchell GH. Microtubule associated motor proteins of Plasmodium falciparum merozoites. Mol Biochem Parasitol. 2001 117:187-200. Copyright Elsevier
See original on MMP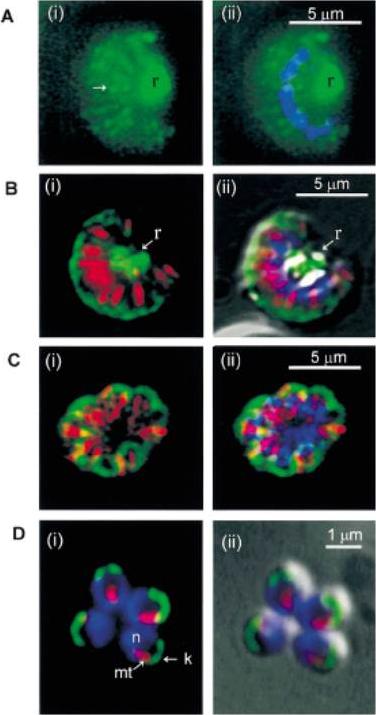
Fluorescent images of schizonts undergoing merogony (A–C), and four merozoites (D), labelled with antibodies to kinesin heavy chains (green) and a-tubulin (red), which labels the microtubules of f-MASTs, (merozoite assemblage of sub-pellicular mt) and DAPI nuclear stain (blue). A. Kinesin labelling is primarily associated with the residual body (r), but also radiates out in a series of linear arrays of discrete fluorescent points (Arrow) (i). Nuclei are shown by the DAPI staining (ii). B(i), kinesin labelling is seen at the periphery of the schizont, where the merozoite apices lie, and in the residual body (r), which is distinguished by the white glow of the pigment seen in the overlaid DIC image (ii). C(i), kinesin staining is apparent only at the periphery of the schizont where the merozoite apices are located, and is not apparent in the residual body area. D(i), the nuclei (n) are situated at the base of the merozoites, the f-MASTs (mt) run laterally, and the kinesin labelling (k) appears to be located close to the membrane at the apices, as judged by its proximity to the cell surface in the overlaid DIC image (ii).Fowler RE, Smith AM, Whitehorn J, Williams IT, Bannister LH, Mitchell GH. Microtubule associated motor proteins of Plasmodium falciparum merozoites. Mol Biochem Parasitol. 2001 117:187-200.
See original on MMPMore information
| PlasmoDB | PF3D7_0111000 |
| GeneDB | PF3D7_0111000 |
| Malaria Metabolic Pathways | Localisation images Pathways mapped to |
| Previous ID(s) | MAL1P2.36, PFA0535c |
| Orthologs | PBANKA_0202700 , PCHAS_0201100 , PKNH_0202500 , PVP01_0204100 , PVX_081250 , PY17X_0204100 |
| Google Scholar | Search for all mentions of this gene |